- The District Admin report is available to district admins and shows data across all schools in the district.
- The School Admin report is available to school admins and shows data for all students and teachers from the schools they manage.
District Admin report
Most charts reflect data within the selected date range, except the monthly trend charts for Usage, Growth, and Course Progress.
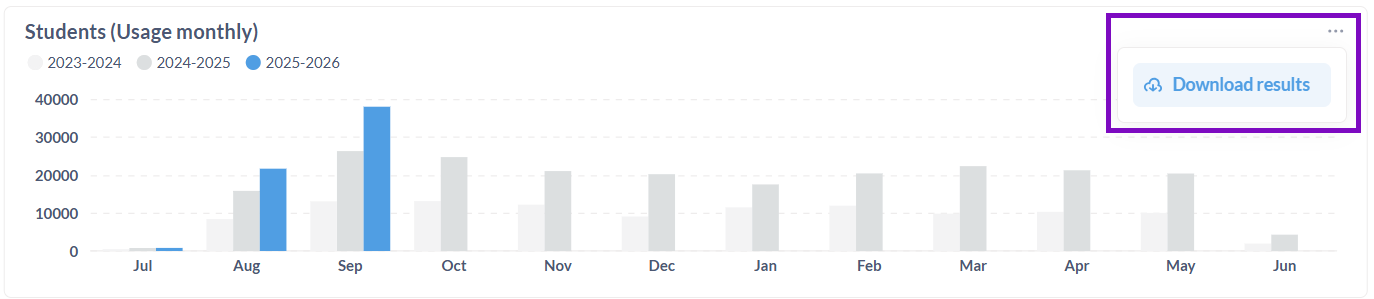
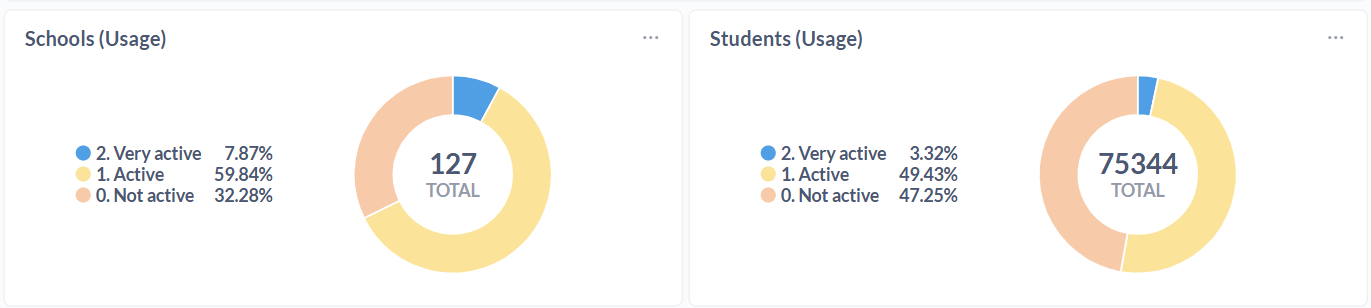
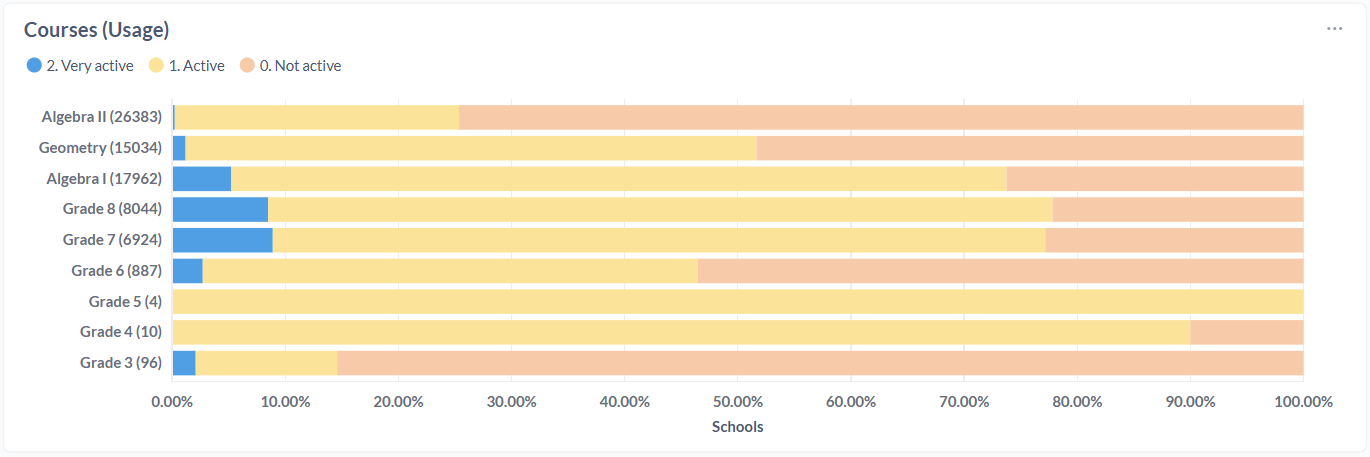
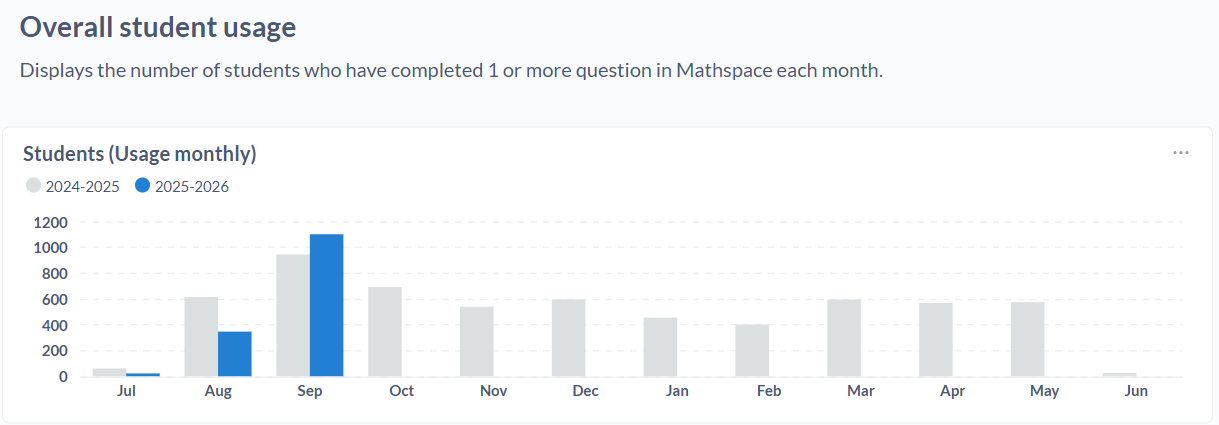
Usage

- Very active: more than 20 questions per week
- Active: at least 1 question per week
- Not active: no activity recorded
Activity levels are calculated based on engagement during the selected date range and only include the weeks after each student joined Mathspace, ensuring results reflect their actual usage period.
Performance

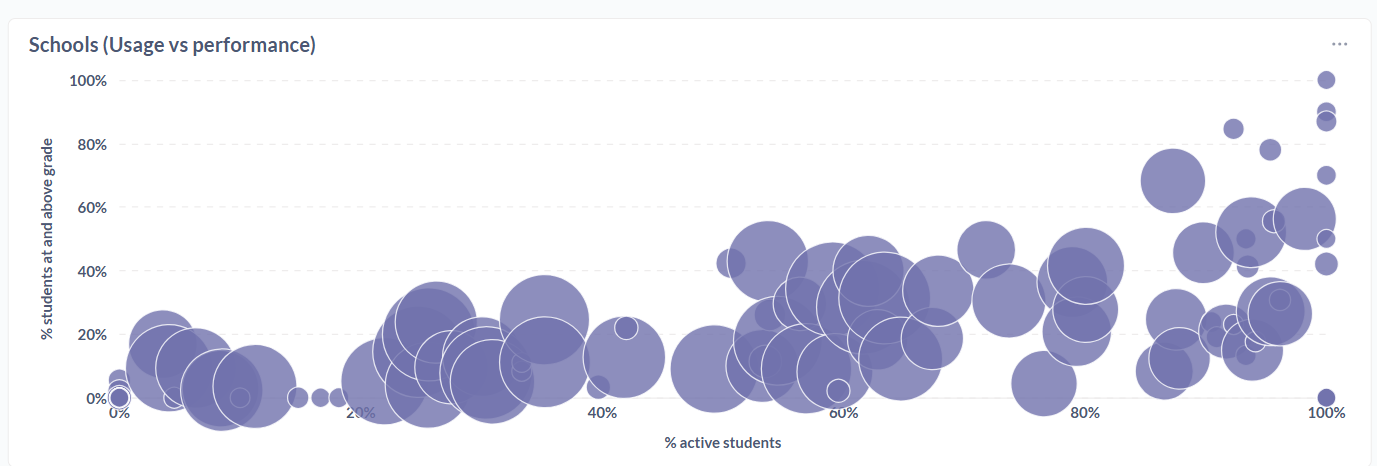
It also includes performance categories, which group students based on how their overall grade level (determined by their work in Mathspace) compares with their enrolled grade:
- Above grade level
- At grade level
- Slightly below
- Far below
Growth

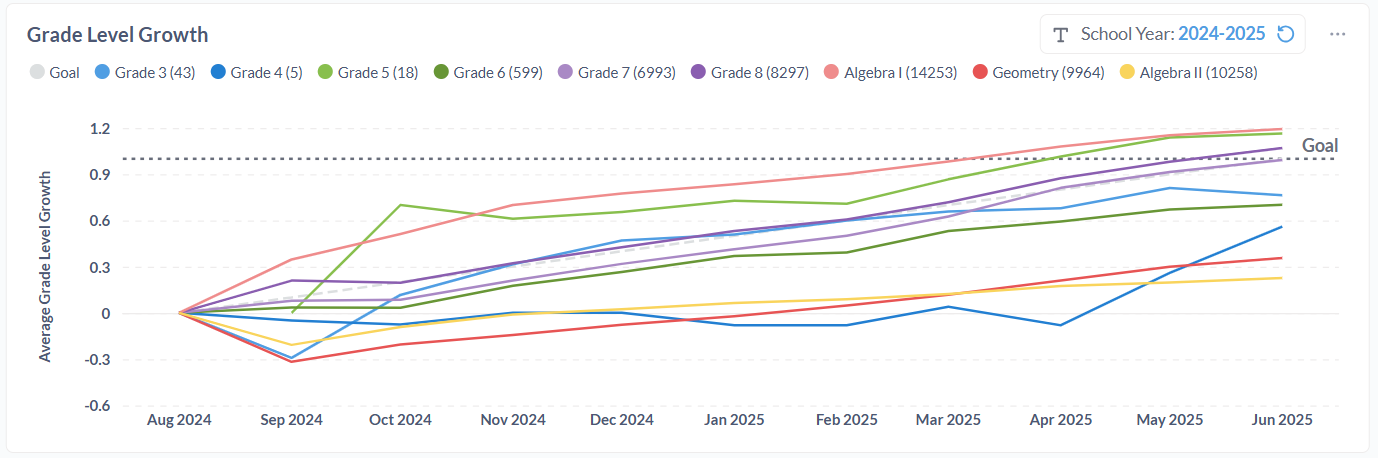
-
- On track: expected to grow at least 1 grade level by year end
- At risk: showing some growth, but not yet on track
- No growth: no measurable growth since the start of the year
Course Progress

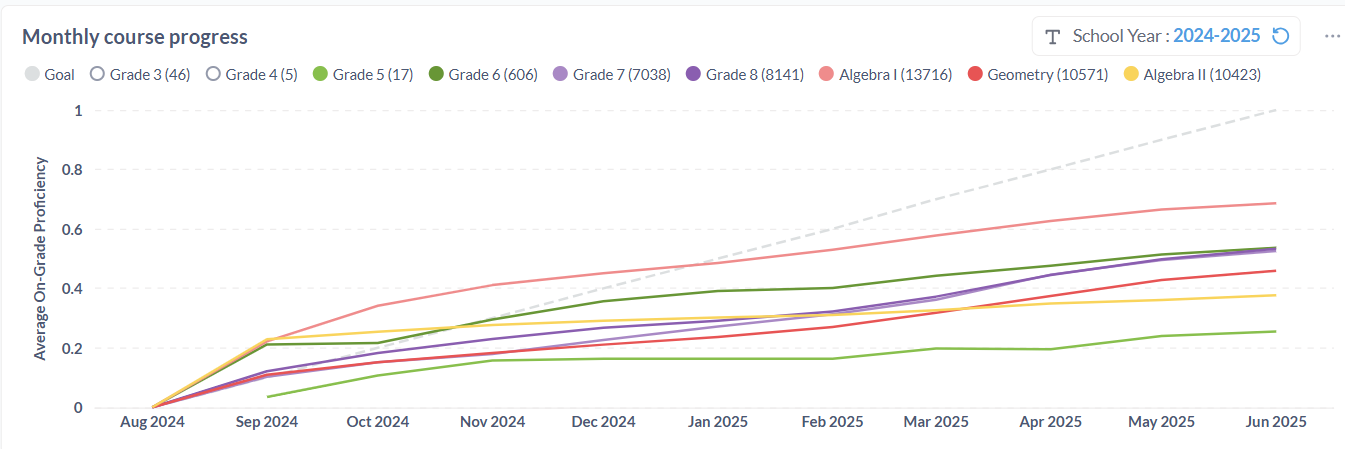
Students are grouped into three progress categories, based on their grade proficiency at their enrolled level:
- On track: expected to complete the course by year end
- At risk: may not complete the course by year end
- No progress: not yet diagnosed
The school and student summaries show the percentage of schools and students in each progress category, giving you a clear picture of how course completion is trending across the district. The section also provides breakdowns by enrolled grade and by school, allowing you to compare results across grades and between schools.
School Admin report
Usage

- Very active: more than 20 questions per week
- Active: at least 1 question per week
- Not active: no activity recorded
Activity levels are calculated based on engagement during the selected date range and only include the weeks after each student joined Mathspace, ensuring results reflect their actual usage period.
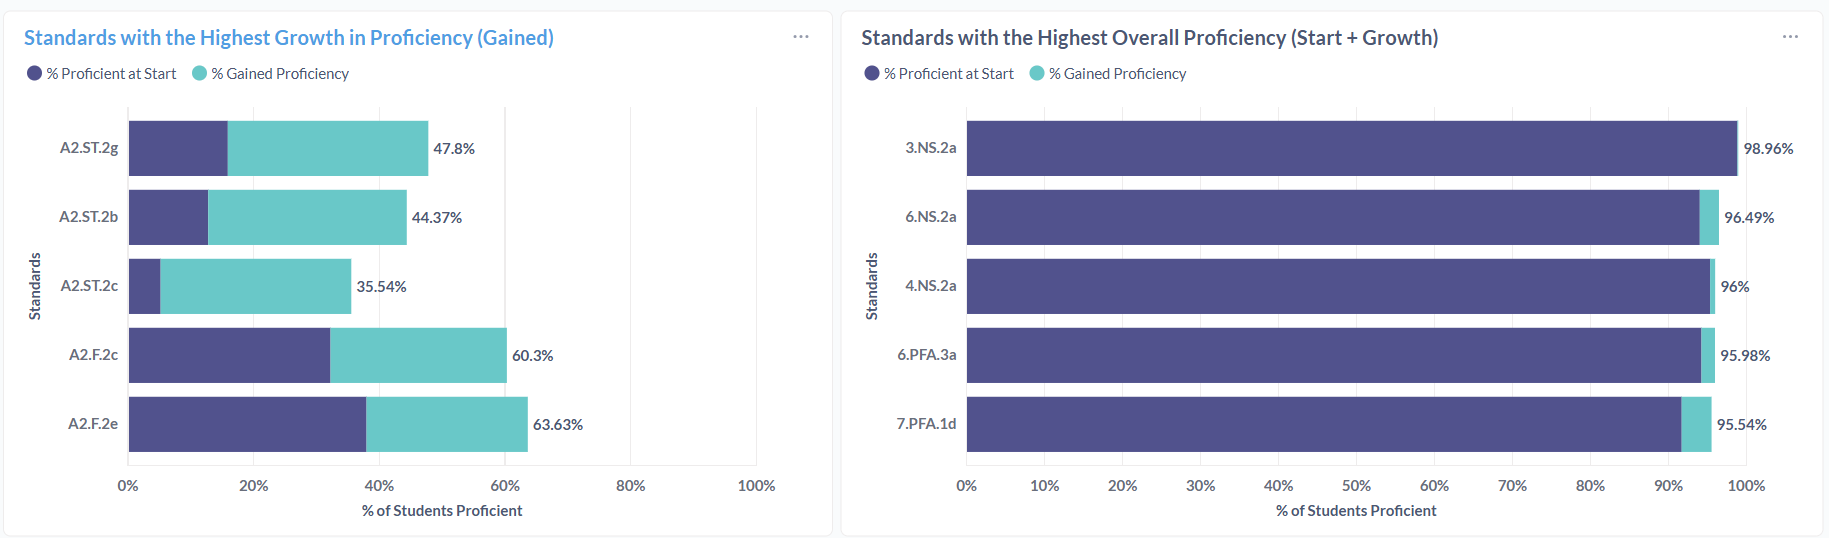
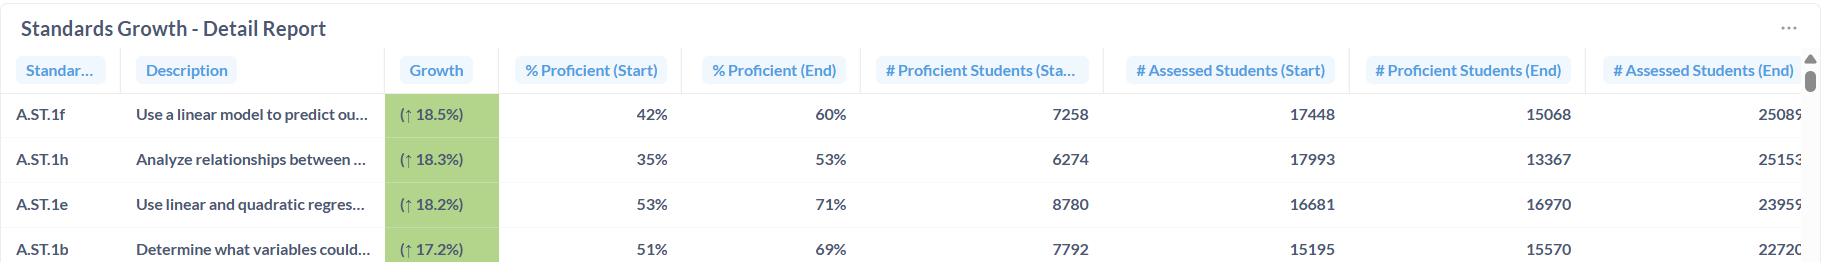
Standards Proficiency

- % Gained proficiency → percentage of students that gained proficiency between the start and end dates
- % Proficient at Start → percentage of students already proficient at the start of the selected period
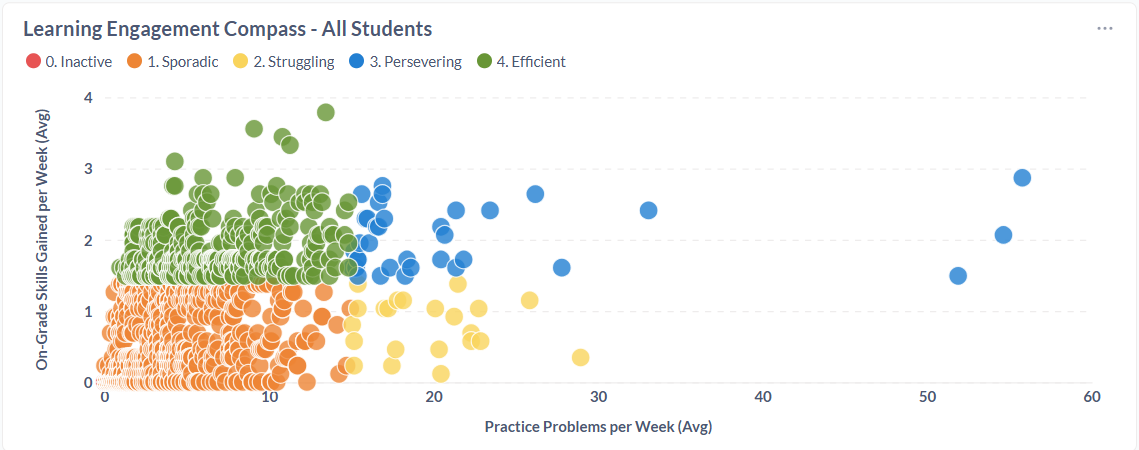
Learning Engagement Compass

- Skill gains: on-grade skills gained per week
- Effort: weekly questions completed (practice problems include all problems from all task types)
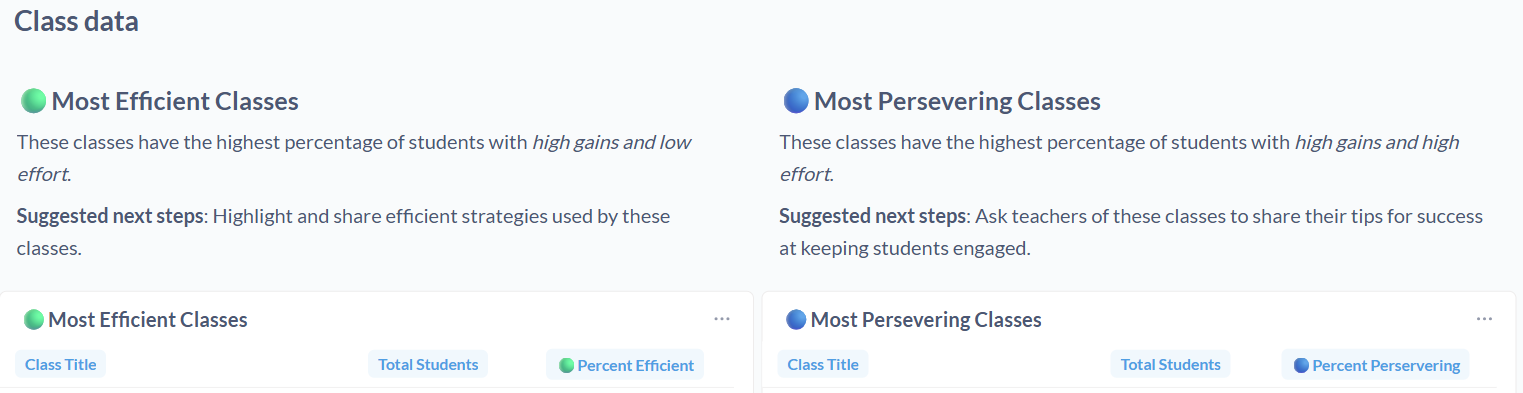
- Efficient: high gains with fewer questions
- Persevering: high gains with high effort
- Struggling: low gains despite high effort
- Sporadic: low gains with low effort
- Inactive: no activity